
There is only one way to trade in a long-term uptrend: long. Forget about picking tops and breaks below short-term moving averages. Leaning bearish within a long-term uptrend is not a profitable strategy. Instead, we should lean bullish and use oversold conditions to our advantage.
In a long-term uptrend, I am only interested in oversold conditions because these provide setups to trade in the direction of the bigger trend. I ignore overbought conditions because it is normal to become overbought in an uptrend. Oversold conditions, on the other hand, occur after a pullback and this is an opportunity to partake in the long-term uptrend.
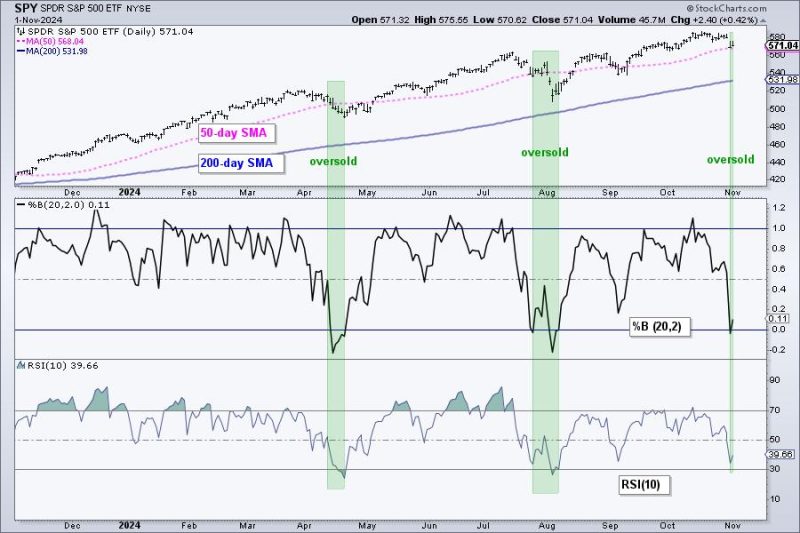
The chart below shows SPY with two momentum oscillators: RSI(10) and %B(20,2). I am using both to identify oversold conditions in a long-term uptrend. SPY is well above its rising 200-day SMA (blue line) so the long-term trend is clearly up. %B tells us the location of the close relative to the Bollinger Bands. The indicator dips below 0 when the close is below the lower Band and this is an oversold condition. RSI becomes oversold with a dip below 30.
On the chart above, we can see %B becoming oversold in mid April, late July and last week (green shading). RSI became oversold in mid April and early August, but has yet to become oversold here in early November. On the price chart, notice that SPY is trading near its 50-day SMA (pink line). Prior dips below the 50-day SMA marked pullbacks within the bigger uptrend, not the start of a bigger trend change.
Oversold conditions are not the signal. Oversold conditions simply serve as an alert to be on guard for a short-term reversal. Keep in mind that price can become oversold and remain oversold. Chartists, therefore, need a bullish catalyst to signal a change from oversold to strength. For RSI and %B, we can use their centerlines to identify an upturn in momentum. The chart below shows these centerlines as short red lines (50 for RSI and 0 for %B).
A bullish signal triggers when RSI becomes oversold and then breaks above 50, while a bullish signal triggers when %B becomes oversold and then breaks above 0. The green arrows show breakouts in late April and mid August. %B became oversold last week and has yet to break above 0. Thus, it is still in oversold condition. RSI did not become oversold. I would like to see both become oversold and then look for the momentum breakouts.
Special Offer!!
2 Educational Reports/Videos with Every Subscription
“Finding Bullish Setup Zones with High Reward Potential and Low Risk”. The trend is your friend, and pullbacks within uptrends present opportunities. We show how to find compelling setups that combine market conditions, trend identification, oversold conditions and trading patterns. Trading is all about the odds and these setups put the odds in your favor.
“Using Breadth for Capitulation, Thrusts, Market Regime and Oversold Conditions”. This report covers four ways to utilize breadth indicators. Capitulation conditions often signal major lows, while thrust signals indicate the start of a bullish phase. Market regime helps distinguish between bull and bear markets, and oversold conditions identify tradable pullbacks within bull markets. We explain the indicators, settings, and signals for each scenario.
Click here for immediate access!
Highlights from Chart Trader (Weekly Reports/Videos):
November 1st Report: Stocks pulled back the last two weeks and we showed five breadth indicators to identify oversold conditions. We are also monitoring the September breakouts and key support levels for QQQ, MAGS, XLK and five other tech-related ETFs. Plus a bearish pattern in SMH. With recent pullbacks, we are seeing oversold conditions in two ETFs and bullish setups in two Healthcare stocks.
October 25th Report: The weight of the evidence remains bullish, but the surge in the 10yr Yield is concerning. We quantify the recent surge and show how stocks reacted to past surges. We continue to monitor the cup-with-handle breakout in SPY, as well as the triangle breakouts in QQQ and the tech-related ETFs. This report also featured trade setups in ETFs and stocks related to industrial metals.
Click here for ChartTrader access!
System Trader: Quantified Strategies with Weekly Signals
Rotation Trader for S&P 500 Stocks (+37% in 2024)
Rotation Trader for Nasdaq 100 Stocks (+14% in 2024)
Rotation Investor for S&P 500 Stocks (debuting this week)
Rotation Investor for Nasdaq 100 Stocks (debuting this week)
Click here for SystemTrader access!
//////////////////////////////////////


